LoraDB v0.8: explain, profile, and faster bindings

LoraDB v0.8 is a diagnostics release.
Until now, the only honest answer to "why is this query slow?" was
"read the executor source." v0.8 changes that. Every binding — Rust,
Node, WASM, Python, Go, Ruby, FFI — and the HTTP server now expose
explain and profile as first-class methods, returning the same
plan tree the engine actually compiles and runs.
The release also includes binding-level speedups for bulk reads. That work is not the headline. The headline is that LoraDB queries are no longer opaque.
What explain and profile are
They are two separate calls with two different contracts.
explain(query, params?) parses, analyzes, and compiles the query and
returns the plan that would run. The executor is never invoked. Even
mutating queries — CREATE, MERGE, SET, DELETE, REMOVE — are
safe to pass: they return a plan and leave the graph untouched. Use
this to inspect what the planner decided before you commit to running
it.
profile(query, params?) runs the query for real and returns the
plan plus runtime metrics. Mutating queries produce the same side
effects they would from execute: WAL is written, snapshots observe
the commit, the live store advances. profile is a measurement tool,
not a sandbox.
In Node:
const plan = await db.explain(
  "MATCH (p:Person) WHERE p.name = $name RETURN p",
  { name: 'Ada' }
);

console.log(plan.shape);          // "readOnly" or "mutating"
console.log(plan.resultColumns);  // ["p"]
console.log(plan.tree.operator);  // top-level physical operator

const profile = await db.profile(
  "MATCH (p:Person) WHERE p.name = $name RETURN p",
  { name: 'Ada' }
);

console.log(profile.metrics.totalElapsedNs);
console.log(profile.metrics.totalRows);
console.log(profile.metrics.perOperator);
The same shape is available over HTTP at POST /explain and
POST /profile, and from Python, Ruby, Go, WASM, and the FFI. The
JSON envelope is identical across every surface.
What the plan tree actually says
explain returns a tree, not a string. Each node carries a stable
id, an operator label (Projection, Filter, NodeByLabelScan,
…), opaque human-readable details, and its children:
{
  "query": "MATCH (p:Person) WHERE p.name = $name RETURN p",
  "shape": "readOnly",
  "resultColumns": ["p"],
  "tree": {
    "id": 3,
    "operator": "Projection",
    "details": { "items": "p" },
    "children": [
      {
        "id": 2,
        "operator": "Filter",
        "details": { "predicate": "..." },
        "children": [
          {
            "id": 1,
            "operator": "NodeByLabelScan",
            "details": { "var": "v0", "labels": "Person" },
            "children": []
          }
        ]
      }
    ]
  }
}
shape is "readOnly" or "mutating" — a property of the plan, not
a guess from the query string. resultColumns is the projection order
the engine will produce. details is for humans; do not parse it.
What profile adds
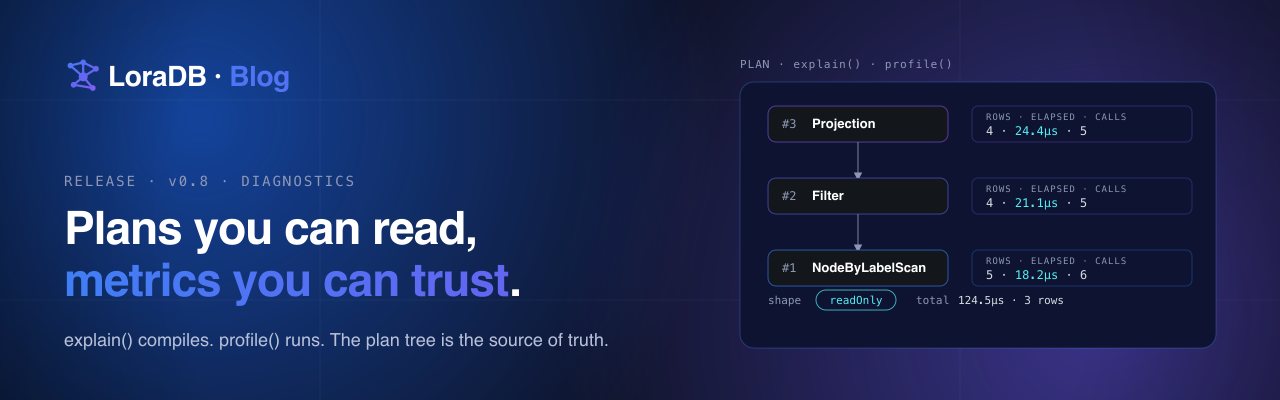
profile decorates the same tree with measurements:
{
  "plan": { "...same shape as /explain..." },
  "metrics": {
    "totalElapsedNs": 124500,
    "totalRows": 3,
    "mutated": false,
    "perOperator": {
      "1": { "rows": 5, "elapsedNs": 18200, "nextCalls": 6, "dbHits": 0 },
      "2": { "rows": 4, "elapsedNs": 21100, "nextCalls": 5, "dbHits": 0 },
      "3": { "rows": 4, "elapsedNs": 24400, "nextCalls": 5, "dbHits": 0 }
    }
  }
}
perOperator keys match tree[*].id. Per-operator elapsedNs is
inclusive of descendants — the "operator + everything below it" view
that matches what is visually surprising when reading a profile.
dbHits is reserved for a future phase and reads 0 today; saying
that out loud is the point of v0.8.
The honest boundary
A few things profile is not in v0.8:
- It is not a query optimizer. There is no cost model yet;
estimatedRowsisnull. - It does not sandbox writes. Mutating queries mutate.
- It does not page or sample. The full plan and metrics ride on a single response.
dbHitsis reserved, not measured. v0.8 reports0rather than a fabricated number.
That last one matters more than it sounds. A diagnostic surface that quietly invents a metric is worse than one that admits the metric is not implemented.
A short word on bindings
v0.8 also includes bulk-buffer changes in the Node, WASM, Go, and FFI bindings. Bulk reads now return a single contiguous binary buffer that the host language decodes locally, instead of crossing the FFI boundary row-by-row. Microbenchmarks show roughly 2–4× faster reads for queries that return many rows.
That work shipped quietly because it doesn't change any API. The
binding signatures are the same; the wire is just narrower. If your
code calls execute and reads many rows, you should see it without
doing anything.
How v0.8 fits the journey
v0.5 made the engine stream. v0.6 made persistence feel like a system. v0.7 was a process release.
v0.8 closes a different gap: the engine has been streaming and
persisting for two releases without giving callers a way to see what
it actually did. explain and profile make the planner and the
executor observable from every surface that runs a query.
The next steps follow from there. Per-operator dbHits, an actual
cost model, plan-stability assertions for tests, and an HTTP params
field on /query are all natural extensions of the same shape.
Read next
v0.8 is the release where LoraDB stops being a black box at the query boundary.