LoraDB v0.15: benchmarks in public

LoraDB v0.15 publishes the numbers.
For most of the release journey the only benchmarks people saw were our internal smoke gates: a fixed set of workloads, a baseline, and "don't regress." That's enough to keep the engine honest with itself. It says nothing about how LoraDB compares to the other embedded and server graph engines a reader might already be using.
v0.15 closes that gap. The comparisons/ crate that drives the
head-to-head suite is now in tree. The full report is committed at
comparisons/report.md. A new /benchmarks page
renders that report with per-engine ranking, per-group breakdowns,
and a head-to-head page per competitor. Every workload that was
skipped on a given engine carries the reason next to it.
What ships
The comparisons/ crate, in tree
comparisons/ is a standalone Rust crate that runs the same workload
matrix against seven engines: LoraDB, Kuzu, Grafeo, SurrealDB,
Memgraph, Neo4j, and HelixDB. Each engine sits behind a small
adapter in comparisons/src/engines/ so the workload code itself
stays engine-agnostic. The workload set is defined declaratively in
comparisons/benches/workloads.yml and driven by Criterion.
The crate has its own [workspace] block, on purpose. It is not
part of LoraDB's own workspace because pulling Kuzu, SurrealDB, and
the Memgraph / Neo4j drivers into the main lock would balloon
contributor compile times for code that only the comparison run
needs. Running it is one command from inside the crate; the README
walks through the engine setup.
Before v0.15 this directory was gitignored. The intent was always to publish the suite, just not while the harness was settling. v0.15 takes the gate off.
comparisons/report.md
The report is a single markdown file generated by
scripts/compare.js after a fresh bench run. It has a summary table
plus one section per benchmark group, each section listing the
workloads with their raw timings and the slowdown ratio against the
row winner. Engines without a like-for-like equivalent for a given
workload get an em-dash, not a fake number, and the reason is
recorded under the section's notes block.
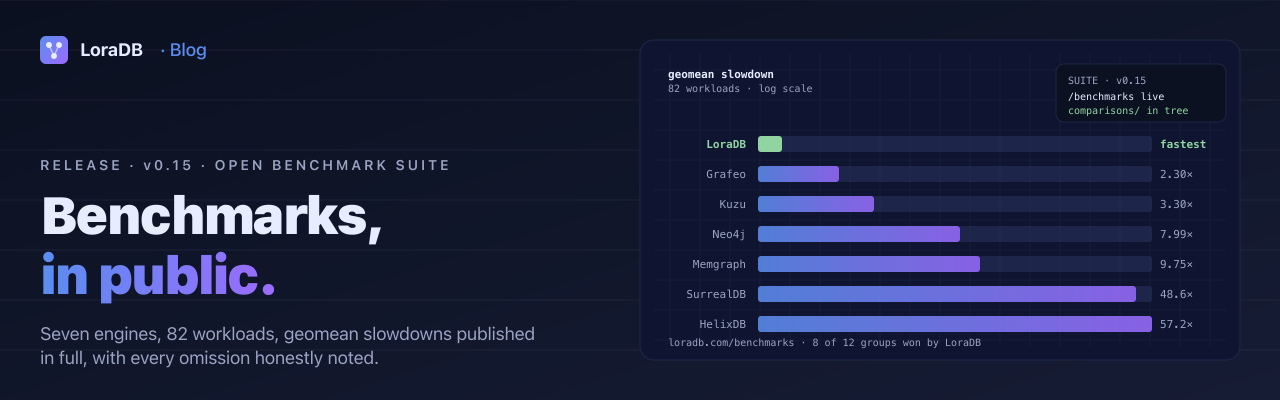
The summary numbers from this run, ordered fastest to slowest by the geomean across all 82 workloads:
| Engine | Total geomean slowdown |
|---|---|
| LoraDB | fastest |
| Grafeo | 2.30× |
| Kuzu | 3.30× |
| Neo4j | 7.99× |
| Memgraph | 9.75× |
| SurrealDB | 48.58× |
| HelixDB | 57.20× |
LoraDB takes the overall row across the 82-workload suite. It also takes 8 of the 12 group rows: scans, predicates, aggregates, pipeline, lists, sort, traversals, and patterns. The other four go elsewhere. Grafeo wins setup and writes (its purpose-built Rust crate path beats LoraDB by roughly 2× on the bulk write group). Kuzu wins strings and numerics (LoraDB sits within 22% on both). The full breakdown is on /benchmarks.
A new /benchmarks experience on the site
The website now has a benchmarks section that mirrors the report's shape. The overview at /benchmarks carries:
- The headline ("fastest overall across 82 workloads") with the next-best total beside it.
- A log-scaled bar chart of total slowdown so the 2× and the 57× remain visually comparable.
- A per-group card grid showing the winner, the workload count, and LoraDB's position on every row.
- The summary table from the report, plus a per-group workload table for every group with omissions noted under each.
Six head-to-head routes live under /benchmarks/lora-vs-<engine>,
one per competitor. Each page reports the overall ratio, the
group-by-group wins, and the raw timings for the workloads both
engines ran. Workloads that the competitor couldn't run end up in a
dedicated "honest omissions" block, with the language-level reason
quoted from the report.
Sticky competitor nav, with proper hide tracking
The competitor pages share a sticky strip across the top so a reader
can move between engines without going back to the overview. The
strip tracks the Docusaurus navbar's hideOnScroll behaviour and
slides up with it when the navbar hides, instead of leaving a
floating band over the content. The mechanism lives in a small
useNavbarHide hook so the same pattern is reusable for future
pinned in-page bars.
What this isn't
A few things this release deliberately doesn't claim:
- It isn't a TPC-style production benchmark. The workloads are microbenchmarks of the query pipeline on fixed in-memory fixtures. They reflect how the engines compile and execute small query shapes, not how a host application would scale a workload.
- It isn't a footprint comparison. Setup, replication, and durability cost are out of scope. Every engine is run in-process or against a local server with a pre-warmed fixture so the timing reflects engine throughput, not deploy ergonomics.
- It isn't a "we beat everyone" piece. Grafeo's setup and write group is a clear win for Grafeo. Kuzu's columnar pipeline is a clear win on string and numeric scalar workloads. We left those in the report because that's where the engines actually sit.
The geomean is also a choice. It dampens single-workload outliers, which means a one-row regression doesn't dominate a group's total the way an arithmetic mean would. The full per-workload timings are in the report for anyone who'd rather compute their own aggregate.
Why publish the suite
Two reasons.
First, the internal smoke gate already keeps the engine honest with itself. It doesn't say anything to a reader evaluating LoraDB against an alternative. Publishing the suite at all is what makes the comparison reproducible: clone the repo, run the bench, get your own report.
Second, every release post on this blog has framed performance work relative to LoraDB's own history (the v0.6 columnar checkpoint post, the v0.8 explain/profile post, the v0.14 staged write path). That framing is honest but it's incomplete. v0.15 widens the frame.
Where to look
- /benchmarks: the overview, per-group breakdown, per-workload tables, methodology.
- /benchmarks/lora-vs-kuzu and the other five competitor pages: head-to-head views.
comparisons/in the repo: the harness itself, engine adapters, the workload YAML, the script that generatesreport.md.comparisons/report.md: the markdown the site is built from. Re-running the suite regenerates this file, which is the source of truth the website pulls from.
What's next: the suite has obvious blind spots (no concurrency workloads, no large-graph traversals, no durability cost) and an obvious format limit (geomean across 82 microbenchmarks is one summary, not the summary). Both of those are workable inside the crate. The harness is in tree, the report is in tree, so the path to the next benchmark group is now a PR away.